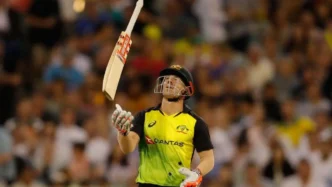
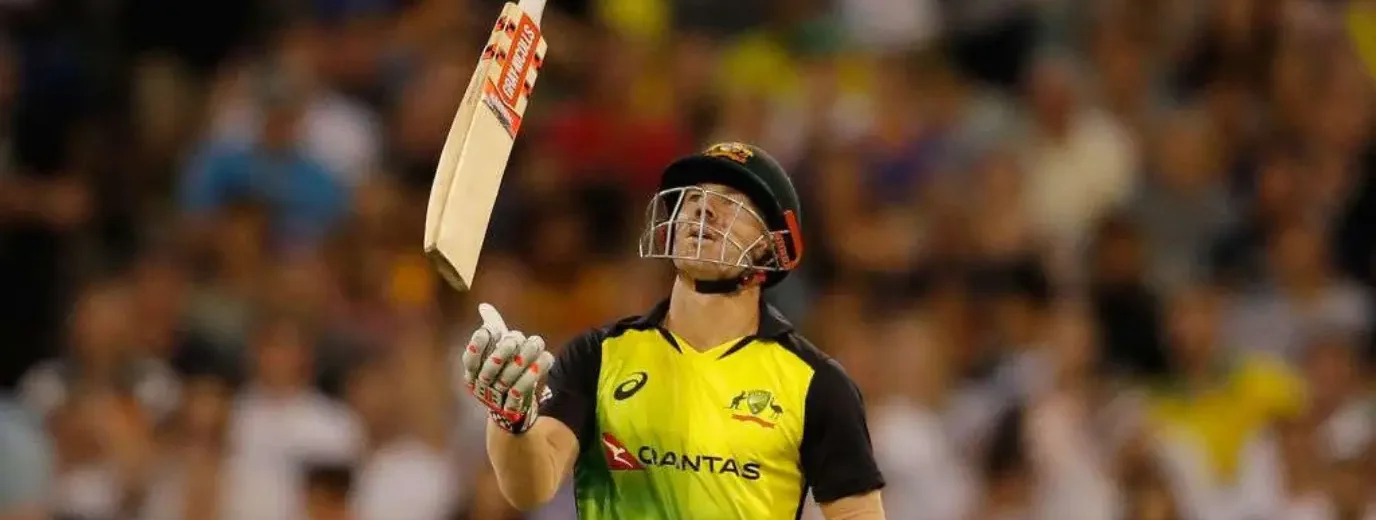
David Warner is the most prolific batter for Australia in T20Is. He has scored the most runs for the Kangaroos in the T20 internationals. Even in the 2024 T20I World Cup, Warner is going at great guns and matching the strike rate of heavy hitters like Marcus Stoinis and Travis Head. He is still a gun fielder who rarely drops any catches. His stats in the T20I cricket for Australia are mind-blowing, and we have covered all of them here.
David Warner T20I Batting Stats
David Warner has played a total of 107 matches in the T20Is. He has batted in all 107 matches to score 3215 runs for Australia. He is the highest scorer for Australia in the T20Is. Warner has been not out in 11 matches despite opening the innings in 100 matches. His highest score in the T20Is is 100 not out. He has scored only one hundred in his career.
The left-handed batter has an average of 33.49 in the shortest format of the game. He has gone above the score of 50 in 27 innings for Australia. Warner has been out on duck in only 6 matches. His scoring rate or strike rate is also quite good, as he scores at a click of over 142 in the T20Is. Warner has struck 119 sixes for the Australian cricket team.
| Matches | 107 |
| Runs | 3215 |
| Not Outs | 11 |
| Highest Score | 100* |
| Average | 33.49 |
| 50s | 27 |
| 100s | 1 |
| Ducks | 6 |
| Strike Rate | 142.83 |
| Sixes | 119 |
David Warner T20I Fielding Stats
David Warner is known for his electrifying fielding, and he rarely puts down any catches. He has caught out 60 batters in the T20Is. 3 catches in an innings is his personal highest in the T20I cricket.
| Catches | 60 |
| Most Catches in an Innings | 3 |
David Warner T20I Captaincy Record
Before the sandpaper controversy, David Warner was involved in the leadership group of the Australian Cricket Team. He has captained Australia in 9 T20I matches to win 8 and lose only 1. His captaincy record is brilliant, but unfortunately, he won’t ever captain the Australian team again due to the proven cheating allegations that brought shame to Cricket Australia. However, not getting to captain again might be good for David Warner, as his batting stats completely tumbled when he acted as the skipper. In the 9 matches that he has played as captain, he could only score 159 runs at an average of 17.67.
| Matches | 9 |
| Won | 8 |
| Lost | 1 |
| Runs Scored | 159 |
| Average | 17.67 |
David Warner T20I Batting Performance by Year
David Warner has been a consistent T20I batter for Australia since 2021. He has played 107 matches, to score 3215 runs, and hit 27 fifties and one century. His best year was 2019 with an average of 287.00. Known for his aggressive batting, Warner maintains a strike rate of 142.83.
| Year | Mat | Inns | NO | 100s | 50s | Ducks | 4s | 6s | HS | Runs | Avg | S/R |
| 2009 | 8 | 8 | 0 | 0 | 2 | 1 | 26 | 9 | 89 | 273 | 34.13 | 139.29 |
| 2010 | 15 | 15 | 0 | 0 | 2 | 1 | 36 | 22 | 72 | 373 | 24.87 | 156.72 |
| 2011 | 6 | 6 | 0 | 0 | 1 | 2 | 16 | 2 | 53 | 129 | 21.50 | 114.16 |
| 2012 | 13 | 13 | 1 | 0 | 3 | 1 | 28 | 18 | 63* | 334 | 27.83 | 133.07 |
| 2013 | 4 | 4 | 1 | 0 | 2 | 0 | 11 | 6 | 90* | 151 | 50.33 | 131.30 |
| 2014 | 6 | 6 | 1 | 0 | 1 | 0 | 20 | 9 | 53* | 184 | 36.80 | 144.88 |
| 2015 | 1 | 1 | 0 | 0 | 0 | 0 | 0 | 0 | 4 | 4 | 4.00 | 66.67 |
| 2016 | 10 | 10 | 0 | 0 | 1 | 0 | 25 | 8 | 77 | 238 | 23.80 | 146.91 |
| 2017 | 2 | 2 | 0 | 0 | 0 | 0 | 2 | 0 | 8 | 10 | 5.00 | 100.00 |
| 2018 | 5 | 5 | 0 | 0 | 1 | 0 | 8 | 5 | 59 | 96 | 19.20 | 157.38 |
| 2019 | 6 | 6 | 5 | 1 | 2 | 0 | 31 | 7 | 100* | 287 | 287.00 | 145.69 |
| 2020 | 5 | 5 | 1 | 0 | 3 | 1 | 15 | 3 | 67* | 186 | 46.50 | 128.28 |
| 2021 | 7 | 7 | 1 | 0 | 3 | 0 | 32 | 10 | 89* | 289 | 48.17 | 146.70 |
| 2022 | 11 | 11 | 1 | 0 | 3 | 0 | 45 | 6 | 75 | 340 | 34.00 | 147.83 |
| 2024 | 8 | 8 | 0 | 0 | 3 | 0 | 36 | 14 | 81 | 321 | 40.13 | 158.13 |
| Overall | 107 | 107 | 11 | 1 | 27 | 6 | 331 | 119 | 100* | 3215 | 33.49 | 142.83 |
