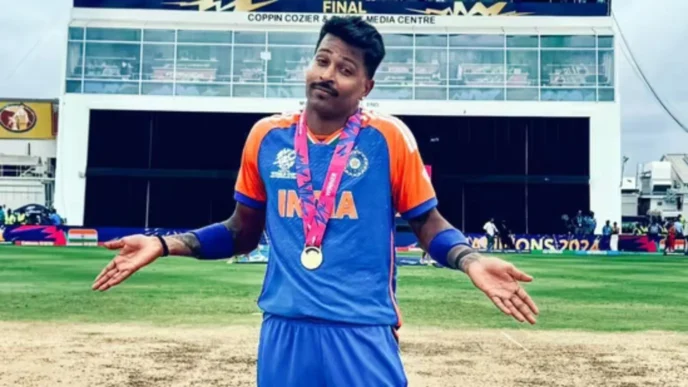
Hardik Pandya is India’s premium batting all-rounder. He is considered one of the most talented cricketers in India due to his attacking batting approach, dynamic fielding and lethal pace bowling. His consistent ability to bowl at 130 km/ph and more separates him from all the other pace-bowling all-rounders like Vijay Shankar and Venkatesh Iyer. He has been instrumental in many victories for India in the T20 format. Pandya has also captained Gujarat Titans and Mumbai Indians in the IPL.
He won the IPL trophy in his first year as captain for Gujarat Titans in IPL 2022. In 2023, he reached the IPL Finals again but this time lost to Chennai Super Kings. Following this, Pandya has captained India in T20Is during the absence of Rohit Sharma. He is currently the vice-captain of India in T20 internationals. BCCI could promote him as the captain after Rohit Sharma’s retirement. This article focuses on the stats and records of Hardik Pandya in T20Is. Let’s find out why he is rated as one of the top cricketers in India.
Hardik Pandya T20I Batting Stats
Hardik Pandya has played 95 matches for India but has batted on only 72 occasions. This is due to him being a finisher and getting fewer chances to bat. He has remained unbeaten in 18 innings. Pandya has accumulated 1355 runs at an average of 25.09 and a healthy strike rate of 138.83. He has gone past a half-century in 3 innings but has not been able to score a century yet. His highest score in the T20Is is an unbeaten 71*.
| Matches | 95 |
| Innings | 72 |
| Not Outs | 18 |
| Aggregate | 1355 |
| Highest Score | 71* |
| Average | 25.09 |
| 30s | 14 |
| 50s | 3 |
| 100s | 0 |
| Ducks | 3 |
| 4s | 97 |
| 6s | 69 |
| Balls Faced | 976 |
| Strike Rate | 138.83 |
| Opened Batting | 0 |
| Top Scored in Innings | 5 |
| % of Team Runs Scored | 9.01 |
Hardik Pandya T20I Bowling Stats
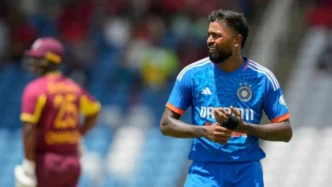
Hardik Pandya is known for his spicy bouncers and new ball swing bowling. He has bowled 250.5 overs for India to pick 80 wickets at an average of 25.19 and an economy rate of 8.03. Pandya has not picked a fifer but has picked 4 wickets in an innings in three different games. His best bowling performance in the T20Is is 4 wickets for 16 runs. He has even managed to bowl 3 maidens in his career. The vice-captain of India is an important part of the Indian pace attack. Without him, the team looks imbalanced.
| Overs | 250.5 |
| Balls | 1505 |
| Maidens | 3 |
| Runs Conceded | 2015 |
| Wickets | 80 |
| Average | 25.19 |
| 3 Wickets in Innings | 9 |
| 4 Wickets in Innings | 3 |
| 5 Wickets in Innings | 0 |
| Best | 4/16 |
| Economy Rate | 8.03 |
| Strike Rate | 18.81 |
| % of Team Wickets Taken | 12.54 |
Hardik Pandya T20I Fielding Stats
Hardik Pandya is one of the finest fielders in India. He has taken some blinders in the field. To date, he has caught out 46 batters for India. The stats do not really justify the fielding abilities of Hardik Pandya. He saves crucial runs for India by running hard in the deep. His ground covering ability is fantastic and his long hands have helped him stop many balls from going to the boundary and ultimately saving India a few significant runs.
| Catches | 46 |
| Most Catches in Match | 2 |
Hardik Pandya T20I Captaincy Stats
Hardik Pandya has captained India in 16 T20I matches, winning 10 and losing 5. 1 match was abandoned during his captaincy. His average as a batter rises to 26.91 when he captains. He has scored 296 runs as the captain of the Indian Cricket Team.
| Matches/Won/Lost | 16/10/5 |
| Tosses Won | 9 (56.25%) |
| Runs Scored | 296 |
| Batting Average | 26.91 |